Pulse ASR Leads Sierra MuBench on P95 Latency: Here's Why this Metric Matters


Average latency doesn't tell the whole story. Discover why P95 latency is the metric that defines real-world voice agent experiences and how Pulse ASR topped Sierra's MuBench leaderboard.
For Speech-to-Text models, latency when evaluated is often reduced to a single average number. The problem is that averages hide variability and tell us little about the distribution of response times. Two systems can have the same average latency while delivering vastly different user experiences. In a voice conversation, it's often the slowest responses, not the average or even median ones, that determine whether an interaction feels seamless or frustrating to the end user.
That's what makes Sierra's MuBench leaderboard particularly interesting. It measures a dimension of performance we believe is often underappreciated in voice AI: tail latency. If you're building voice agents, P95 often tells you far more about the user experience than average latency ever will.
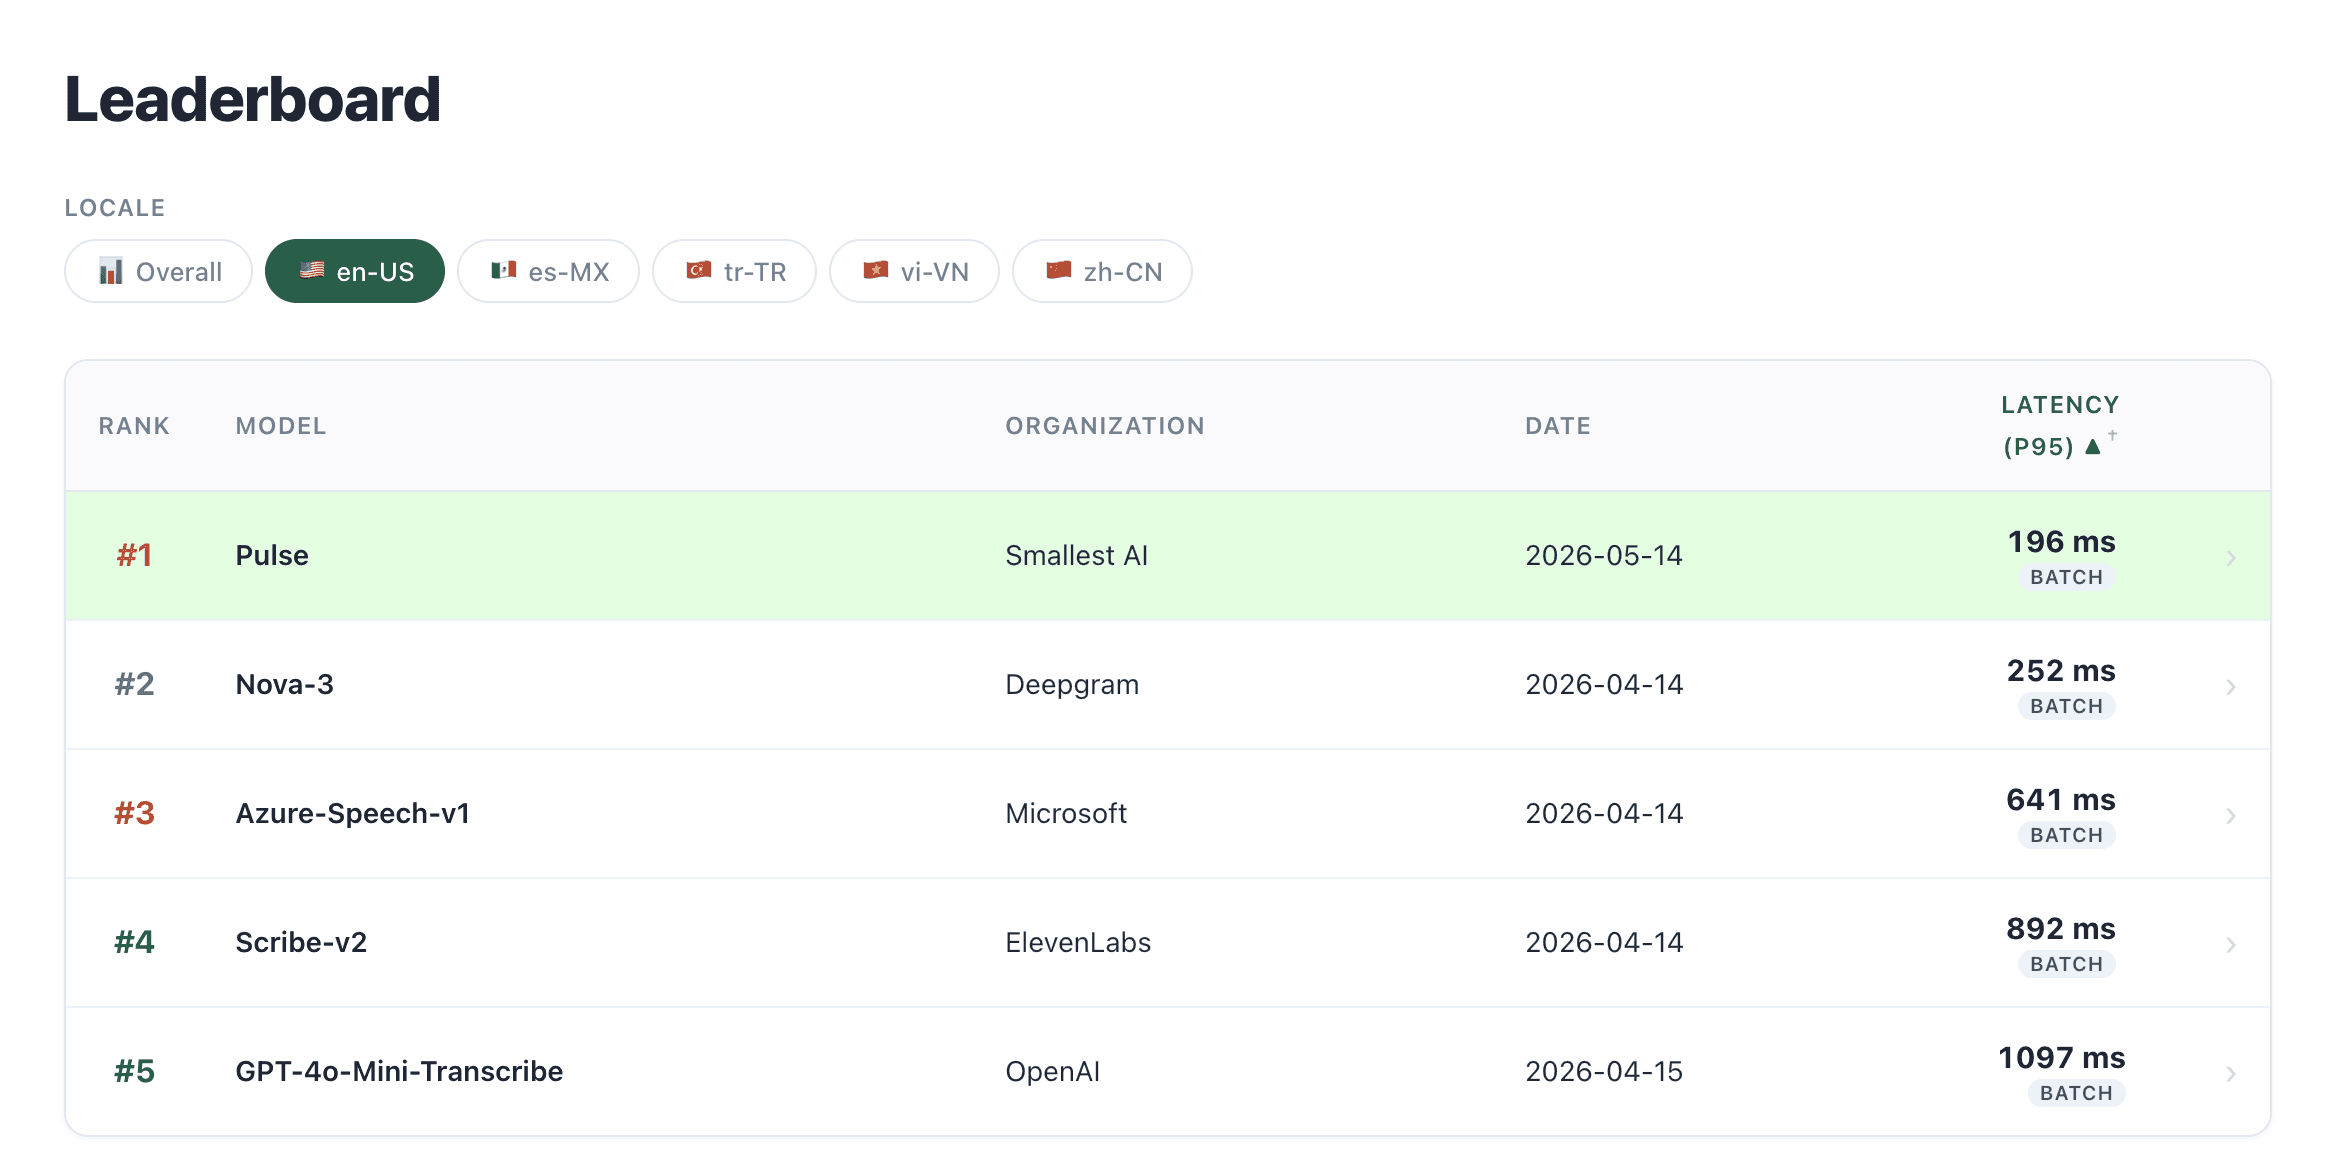
Pulse has been leading Sierra’s MuBench Leaderboard with a P95 latency of 196ms for English.
The 196ms figure is measured on 817 real customer service phone calls recorded at 8kHz mono - telephone-quality audio, not studio recordings - which makes it a more adversarial test than most benchmarks.
Understanding P50, P95, and P99
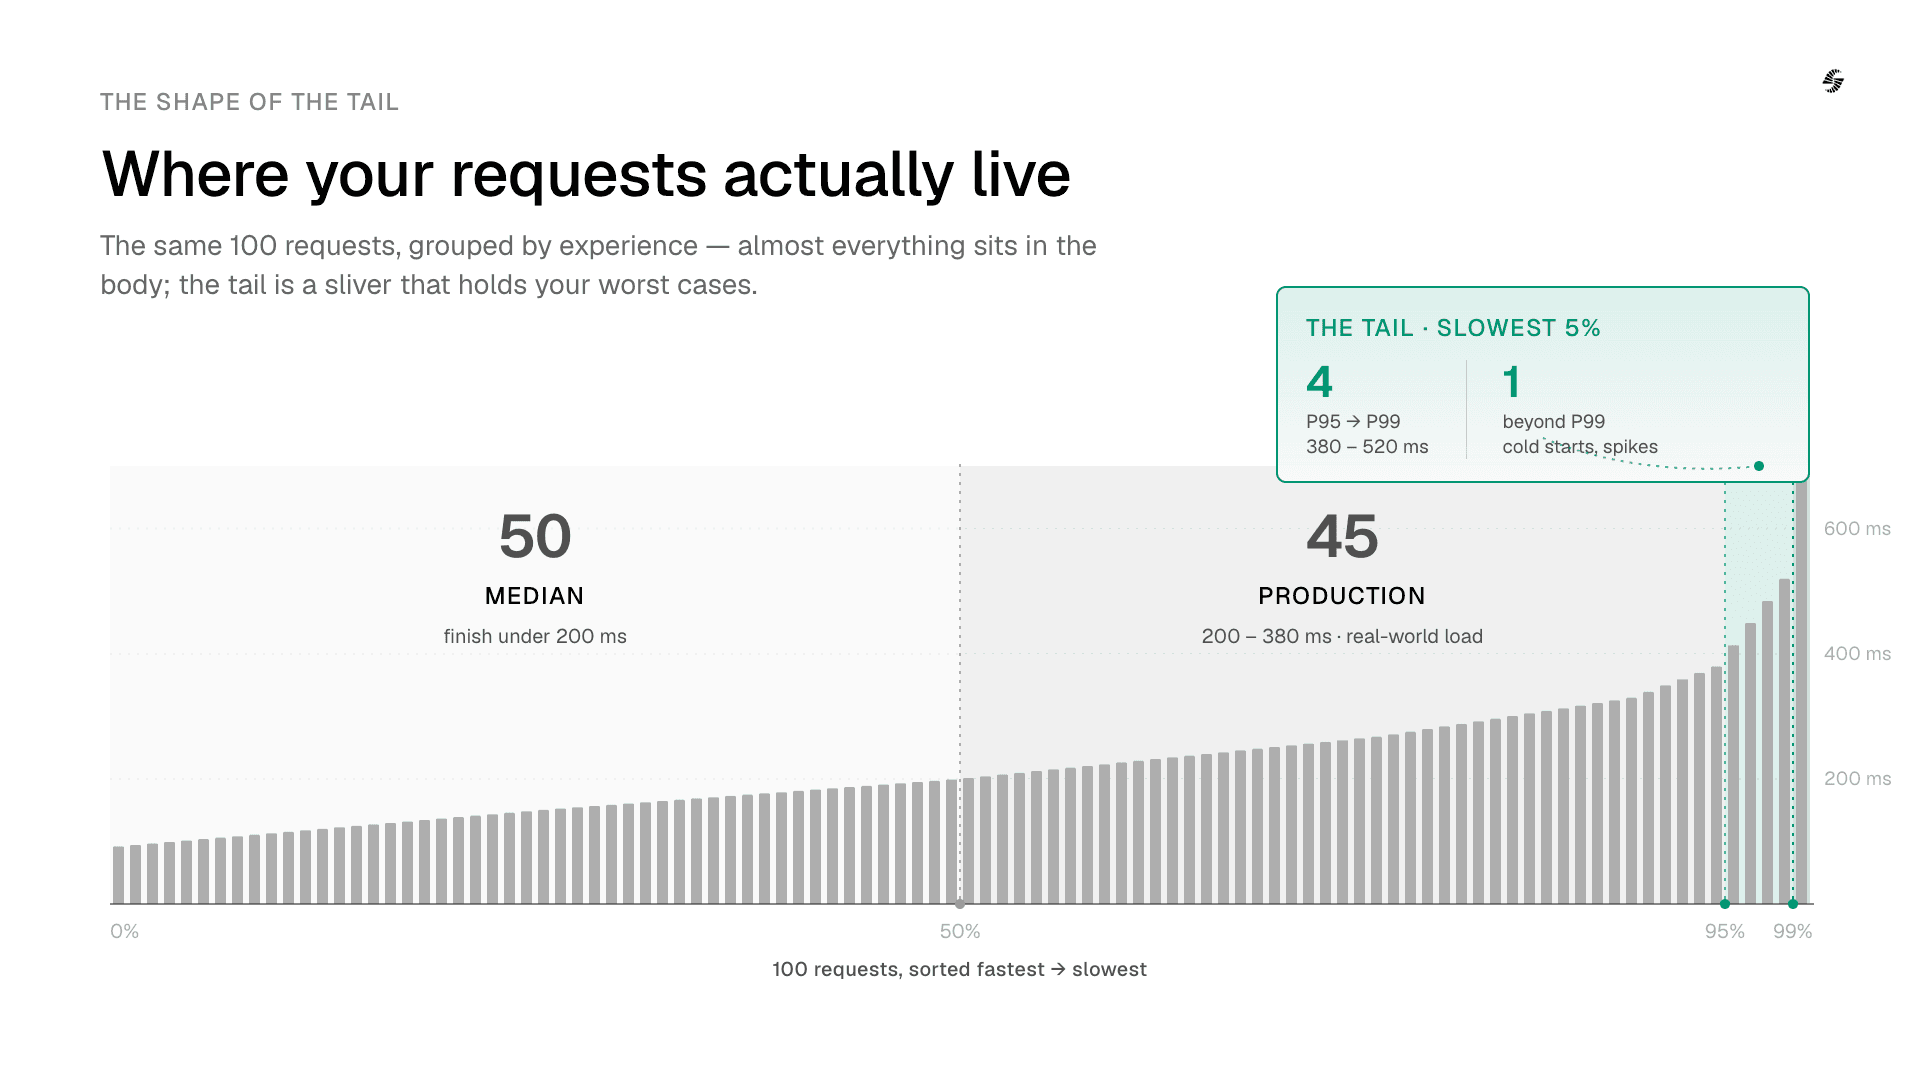
Imagine your speech model processes 100 requests. Sort those requests from fastest to slowest. Percentiles tell us how long users wait at different points in that distribution.
P50: The Median Experience
P50, or the median latency, is the value below which 50% of requests complete.
If your P50 latency is 200 ms, half of all requests finish in under 200 ms, while the other half take longer.
The number represents the middle of the distribution. It's a useful metric, but it tells us little about consistency. Two systems can have identical P50 latencies while exhibiting very different behavior under load.
P95: The Production Experience
P95 is the latency below which 95% of requests complete.
If your P95 latency is 200 ms, then 95 out of every 100 requests finish within 200 ms. The remaining five take longer.
P95 answers the question: How responsive is the system for almost all users?
This is where the effects of real-world production environments begin to appear: queueing delays, traffic bursts, resource contention, network variability, infrastructure bottlenecks.
While P50 describes how a system behaves under typical conditions, P95 reveals how it behaves when those conditions are less than ideal but still common.
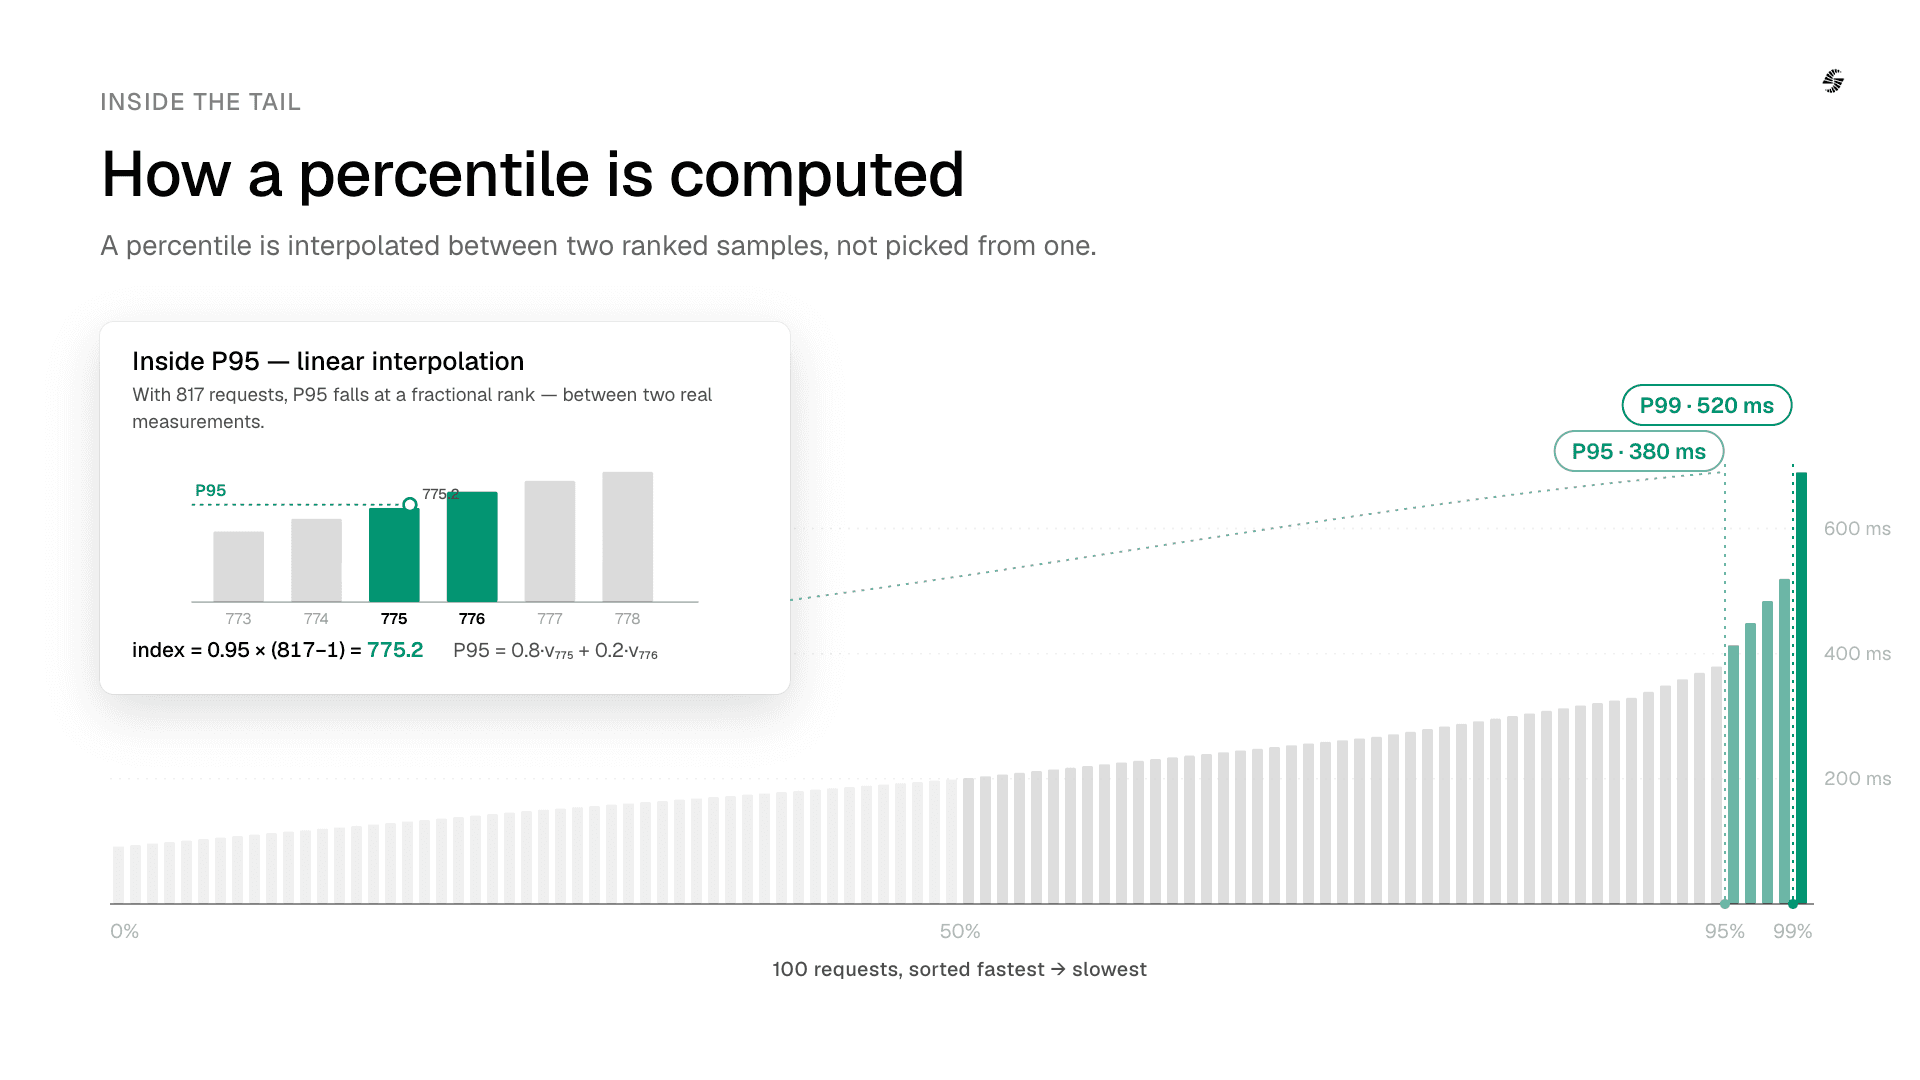
MuBench computes this using linear interpolation: given N sorted latency values, P95 is a weighted blend between the values at rank ⌊0.95(N−1)⌋ and ⌈0.95(N−1)⌉, not simply "pick the 95th value." This produces a more precise estimate at the tail, where precision matters most.
The value of k represents the fractional position of the 95th percentile within a sorted list of measurements. For example, with 817 measurements, the position of P95 is at index 775.2. Because this position falls between two actual observations rather than exactly on one, the percentile is calculated using interpolation: a weighted average of the values at the floor and ceiling positions surrounding it. This ensures a smoother and more accurate estimate of the percentile, especially when the dataset size does not place the desired percentile exactly on a single measurement.
P99: The Tail Experience
P99 is the latency below which 99% of requests complete. It effectively measures the behavior of the slowest 1% of requests.
At this point, we're no longer measuring the performance of the system under normal operating conditions. Instead, we're observing how it behaves when rare sources of latency begin to surface: whether that's a sudden burst of traffic, a cold start, resource contention, or an unusually complex request.
These events may be infrequent, but they often have an outsized impact on user experience and system reliability. As a result, P99 can reveal failure modes that remain invisible at lower percentiles.
The tradeoff is that P99 is inherently more sensitive to rare events than P95. Small fluctuations in infrastructure or workload characteristics can significantly affect the slowest 1% of requests, making the metric more volatile and often harder to optimize directly.
Why Voice Agents Care About P95 More Than Most AI Systems
Consider two voice agents:
Metric | Agent A | Agent B |
|---|---|---|
P50 Latency | 100ms | 175ms |
P95 Latency | 850ms | 250ms |
If we looked only at P50, Agent A would appear faster and most benchmark summaries would rank it higher. Yet in practice, many users would likely prefer Agent B.
Because conversations depend not just on speed, but on predictability.
Agent A feels impressive until it doesn't. Most responses arrive almost instantly, but every so often the conversation stalls for several seconds. When that happens, users begin second-guessing the interaction:
Did it hear me?
Is it still processing?
Should I repeat myself?
The latency itself becomes part of the conversation.
Agent B, on the other hand, is slightly slower but consistently responsive. Users quickly adapt to a predictable response pattern, even if it's not the absolute fastest.
A useful analogy is commuting. Most people would rather take a route that consistently gets them to work in 18 minutes than one that usually takes 12 minutes but occasionally takes 45. The average journey may be shorter, but the uncertainty is what creates frustration.
This is precisely what P95 captures. It measures not just how fast a system can be, but how often it remains fast when conditions are less than ideal.
There's also a protocol distinction worth understanding. For batch APIs, latency is measured as the full round-trip time from sending audio to receiving a complete transcript. Streaming APIs, however, introduce two separate latency metrics: Time to First Token (TTFT), which measures when the first partial transcript becomes available, and Time-to-Complete-Transcript, which measures when the final transcript is returned.
MuBench ranks models based on Time-to-Complete-Transcript for both batch and streaming systems. This distinction is important because a voice agent can only reliably act once it has received enough information to formulate a response. A system may achieve an impressive TTFT by returning partial transcripts quickly, yet still exhibit poor P95 latency on the final transcript. Ultimately, it is the time-to-complete-transcript that determines whether an interaction feels responsive or whether the conversation appears to stall.
Why Tail Latency Is Hard
One of the reasons P95 is such a useful metric is that it's significantly harder to optimize than P50.
In production, requests don't arrive one at a time under ideal conditions. They compete for compute resources, wait in queues, share infrastructure, and experience varying network conditions. Small delays that are almost invisible at P50 begin to accumulate at higher percentiles.
This phenomenon has been extensively studied in distributed systems. In their influential paper The Tail at Scale, Dean and Barroso observed that even when individual components are highly reliable, large-scale systems can still exhibit significant tail latency because a single slow component is often enough to delay the overall request.
Dean and Barroso quantified this effect with a simple example: if a single server has just a 1% chance of returning a slow response, a request that fans out across 100 servers has a roughly 63% chance of being delayed by at least one of them (1 − 0.99¹⁰⁰ ≈ 0.63). In other words, each component may be individually reliable, but when many components work together, the probability that at least one becomes a bottleneck rises dramatically.
Voice systems are particularly susceptible to this effect.
A voice interaction is not a single model invocation. It is a pipeline consisting of speech recognition, language model inference, speech synthesis, networking, and audio streaming. Each stage introduces its own latency distribution. As requests move through the pipeline, delays accumulate, making the tail increasingly important.
This is why reducing P95 latency is often much harder than reducing P50 latency. It requires optimizing not just the model, but the entire serving stack around it.
Why 196ms Means What It Says
P95 sits in a useful middle ground: it is high enough to expose systemic issues that users actually encounter, yet stable enough to optimize against and compare across systems.
What makes MuBench's measurement particularly rigorous is the methodology behind it. Latency is measured as wall-clock time from the moment the client sends the request to the moment the final transcript is received. It is not based on provider-side telemetry or Time to First Token (TTFT). Requests are executed sequentially, one at a time, from a single pinned AWS region. This is an important distinction because parallelized or bulk measurements can artificially compress tail latency. By enforcing a concurrency of one, MuBench ensures that the reported P95 more closely reflects the latency a real integration would experience in production.
In voice AI, users do not judge systems based on averages. They judge them based on whether conversations feel natural and responsive. That ultimately comes down to the tail and it matters how carefully that tail is measured.
What is the difference between P50, P95, and P99?
What is tail latency, and why does it matter for voice agents?
What is Time to First Token (TTFT) vs. Time-to-Complete-Transcript?
What is Word Error Rate (WER)?
How is P95 latency calculated?

